File:VFPt flat magnets gap.svg
Jump to navigation
Jump to search

Size of this PNG preview of this SVG file: 600 × 600 pixels. Other resolutions: 240 × 240 pixels | 480 × 480 pixels | 768 × 768 pixels | 1,024 × 1,024 pixels | 2,048 × 2,048 pixels.
Original file (SVG file, nominally 800 × 800 pixels, file size: 66 KB)
Summary
| Description |
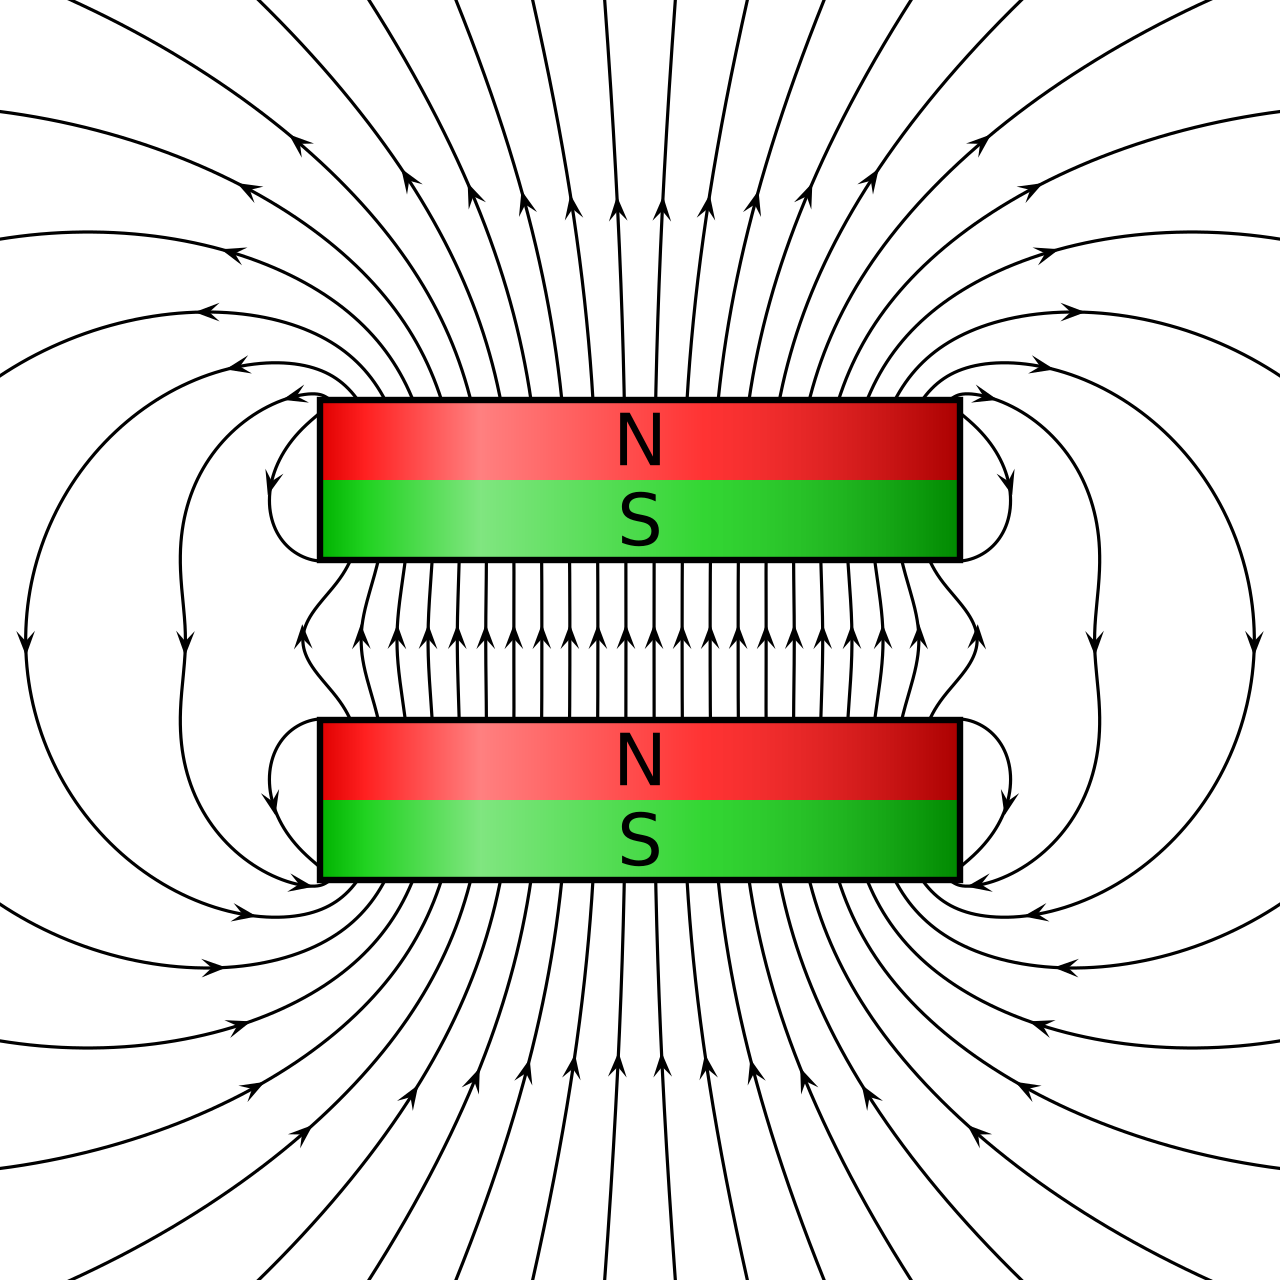
English: Drawing of two homogeneously magnetized flat cylindrical magnets with exactly computed magnetic field lines for the case of vanishing susceptibility (). The two magnets are aligned on top of each other along the cylinder axis and with a narrow gap in-between. This configuration is often used as a dipole magnet to create a strong and roughly uniform magnetic field in the gap, for instance in cyclotrons. |
||
| Date | |||
| Source | Own work | ||
| Author | Geek3 | ||
| Other versions |
   |
||
| SVG development | |||
| Source code | Python code
|

Licensing
I, the copyright holder of this work, hereby publish it under the following license:
This file is licensed under the Creative Commons Attribution-Share Alike 4.0 International license.
- You are free:
- to share – to copy, distribute and transmit the work
- to remix – to adapt the work
- Under the following conditions:
- attribution – You must give appropriate credit, provide a link to the license, and indicate if changes were made. You may do so in any reasonable manner, but not in any way that suggests the licensor endorses you or your use.
- share alike – If you remix, transform, or build upon the material, you must distribute your contributions under the same or compatible license as the original.
File history
Click on a date/time to view the file as it appeared at that time.
| Date/Time | Thumbnail | Dimensions | User | Comment | |
|---|---|---|---|---|---|
| current | 17:25, 16 December 2018 | | 800 × 800 (66 KB) | wikimediacommons>Geek3 | User created page with UploadWizard |
File usage
The following page uses this file: