Golden Valley County, North Dakota
Template:Short description Template:Use American English Template:Use mdy dates Template:Infobox U.S. county
Golden Valley County is a county in the U.S. state of North Dakota. As of the 2020 census, the population was 1,736,<ref name="2020 Census (City)">{{#invoke:citation/CS1|citation |CitationClass=web }}</ref> and was estimated to be 1,795 in 2024.<ref name="QF"/> making it the fifth-least populous county in North Dakota. The county seat and the largest city is Beach.<ref>{{#invoke:citation/CS1|citation |CitationClass=web }}</ref>
The county should not be confused with the city of Golden Valley, which is located in Mercer County.
History
In the general election held November 8, 1910, the voters of Billings County chose to separate the western portion of Billings and form a new county. This result was immediately challenged in court; on September 19, 1912, the ND Supreme Court upheld the election result; therefore the legislature completed the county's organization on November 13, 1912.<ref>{{#invoke:citation/CS1|citation |CitationClass=web }}</ref><ref>{{#invoke:citation/CS1|citation |CitationClass=web }}</ref>
Golden Valley was called 'Rattlesnake Flats' by early settlers, due to the large number of the snakes found in the area. The region was dubbed Golden Valley in 1902 after a group of land surveyors noticed that the sunlight gave the surrounding grasses a distinct golden color.<ref name=archives>Template:Cite book Retrieved via Ancestry.com.</ref>
Election controversy
The vote in 1910 to create Golden Valley County was 837 for and 756 against. Shortly after the vote was certified, suit was filed against the Billings County Commission to overturn the result. The plaintiffs alleged that the certification of election was improper, and that certain pre-marked "unofficial" ballots printed by supporters of the new county were cast in place of official ballots, and should be voided. The trial court originally ruled in favor of the plaintiffs. The county appealed to the North Dakota Supreme Court, which upheld the county's certification of the election. The court also ruled the pre-marked ballots were invalid, but that the number of invalid votes was not sufficient to overturn the election results.<ref>Template:Cite court, Template:Cite court Retrieved via Westlaw.</ref> The court's decision upholding the new county was made on September 19, 1912, and Golden Valley was formally organized on November 13, 1912.

Geography
Golden Valley County lies on the west line of North Dakota. Its west boundary line abuts the east boundary line of the state of Montana. Beaver Creek flows east-northeastward through the upper portion of the county, and Little Missouri River flows northeastward through the southeastern corner of the county, with gullies flowing southeastward draining the lower county into the Little Mo River. The county terrain consists of semi-arid hills, dedicated to agriculture in the level areas.<ref name="GVCND">{{#invoke:citation/CS1|citation |CitationClass=web }}</ref> The terrain slopes to the east and north, with its highest point on hills at the southwestern corner at Template:Convert ASL.<ref>{{#invoke:citation/CS1|citation |CitationClass=web }}</ref>
According to the United States Census Bureau, the county has a total area of Template:Convert, of which Template:Convert is land and Template:Convert (0.16%) is water.<ref>{{#invoke:citation/CS1|citation |CitationClass=web }}</ref> It is the 38th largest county in North Dakota by total area.<ref>{{#invoke:citation/CS1|citation |CitationClass=web }}</ref>
Major highways
Adjacent counties
- McKenzie County (north)
- Billings County (east)
- Slope County (south)
- Fallon County, Montana (southwest)
- Wibaux County, Montana (west)
National protected area
Lakes
Source:<ref name=GVCND/>
- Bosserman Lake
- Camels Hump Lake
- Odland Dam
Demographics
As of the fourth quarter of 2024, the median home value in Golden Valley County was $126,299.<ref>{{#invoke:citation/CS1|citation |CitationClass=web }}</ref>
As of the 2023 American Community Survey, there are 663 estimated households in Golden Valley County with an average of 2.48 persons per household. The county has a median household income of $76,528. Approximately 11.7% of the county's population lives at or below the poverty line. Golden Valley County has an estimated 59.3% employment rate, with 18.0% of the population holding a bachelor's degree or higher and 96.6% holding a high school diploma.<ref name="QF">{{#invoke:citation/CS1|citation |CitationClass=web }}</ref>
The top five reported ancestries (people were allowed to report up to two ancestries, thus the figures will generally add to more than 100%) were English (98.7%), Spanish (0.5%), Indo-European (0.2%), Asian and Pacific Islander (0.6%), and Other (0.0%).
The median age in the county was 45.7 years.
Golden Valley County, North Dakota – racial and ethnic composition
Template:Nobold
| Race / ethnicity (NH = non-Hispanic) | citation | CitationClass=web
}}</ref> !! Pop. 1990<ref name="Census 1990">{{#invoke:citation/CS1|citation |
CitationClass=web
}}</ref> !! Pop. 2000<ref name=2000CensusP004>{{#invoke:citation/CS1|citation |
CitationClass=web
}}</ref> !! Pop. 2010<ref name=2010CensusP2>{{#invoke:citation/CS1|citation |
CitationClass=web
}}</ref> !! Template:Partial<ref name=2020CensusP2>{{#invoke:citation/CS1|citation |
CitationClass=web
}}</ref> |
|---|---|---|---|---|---|---|
| White alone (NH) | 2,377 (99.41%) |
2,087 (99.00%) |
1,870 (97.19%) |
1,613 (96.01%) |
1,600 (92.17%) | |
| Black or African American alone (NH) | 2 (0.08%) |
0 (0.00%) |
0 (0.00%) |
9 (0.54%) |
5 (0.29%) | |
| Native American or Alaska Native alone (NH) | 6 (0.25%) |
12 (0.57%) |
12 (0.62%) |
10 (0.60%) |
12 (0.69%) | |
| Asian alone (NH) | 0 (0.00%) |
8 (0.38%) |
2 (0.10%) |
1 (0.06%) |
1 (0.06%) | |
| Pacific Islander alone (NH) | — | — | 0 (0.00%) |
1 (0.06%) |
1 (0.06%) | |
| Other race alone (NH) | 3 (0.13%) |
0 (0.00%) |
0 (0.00%) |
0 (0.00%) |
4 (0.23%) | |
| Mixed race or multiracial (NH) | — | — | 20 (1.04%) |
11 (0.65%) |
65 (3.74%) | |
| Hispanic or Latino (any race) | 3 (0.13%) |
1 (0.05%) |
20 (1.04%) |
35 (2.08%) |
48 (2.76%) | |
| Total | 2,391 (100.00%) |
2,108 (100.00%) |
1,924 (100.00%) |
1,680 (100.00%) |
1,736 (100.00%) |
2024 estimate
As of the 2024 estimate, there were 1,795 people and 663 households residing in the county. There were 911 housing units at an average density of Template:Convert. The racial makeup of the county was 95.4% White (91.5% NH White), 0.9% African American, 1.3% Native American, 0.2% Asian, 0.1% Pacific Islander, _% from some other races and 2.2% from two or more races. Hispanic or Latino people of any race were 4.5% of the population.<ref>{{#invoke:citation/CS1|citation |CitationClass=web }}</ref>
2020 census
As of the 2020 census, there were 1,736 people, 721 households, and 445 families residing in the county.<ref>{{#invoke:citation/CS1|citation |CitationClass=web }}</ref> The population density was Template:Convert. There were 899 housing units at an average density of Template:Convert. The racial makeup of the county was 93.32% White, 0.29% African American, 0.69% Native American, 0.06% Asian, 0.06% Pacific Islander, 0.35% from some other races and 5.24% from two or more races. Hispanic or Latino people of any race were 2.76% of the population.<ref>{{#invoke:citation/CS1|citation |CitationClass=web }}</ref>
2010 census
As of the 2010 census, there were 1,680 people, 774 households, and 429 families residing in the county. The population density was Template:Convert. There were 967 housing units at an average density of Template:Convert. The racial makeup of the county was 97.44% White, 0.60% African American, 0.60% Native American, 0.06% Asian, 0.06% Pacific Islander, 0.48% from some other races and 0.77% from two or more races. Hispanic or Latino people of any race were 2.08% of the population.
In terms of ancestry, 69.0% were German, 14.7% were Norwegian, 10.7% were Polish, 7.9% were Irish, 7.5% were English, and 2.5% were American.
There were 774 households, 22.7% had children under the age of 18 living with them, 48.4% were married couples living together, 4.3% had a female householder with no husband present, 44.6% were non-families, and 39.4% of all households were made up of individuals. The average household size was 2.10 and the average family size was 2.85. The median age was 45.9 years.
The median income for a household in the county was $33,333 and the median income for a family was $47,500. Males had a median income of $32,875 versus $26,750 for females. The per capita income for the county was $21,899. About 8.9% of families and 13.0% of the population were below the poverty line, including 17.7% of those under age 18 and 11.4% of those age 65 or over.
Population by decade
<timeline> Colors=
 id:lightgrey value:gray(0.9)
 id:darkgrey  value:gray(0.8)
 id:sfondo value:rgb(1,1,1)
 id:barra value:rgb(0.55,0.0,0.0)
ImageSize = width:600 height:300 PlotArea = left:50 bottom:50 top:30 right:30 DateFormat = x.y Period = from:0 till:4832 TimeAxis = orientation:vertical AlignBars = late ScaleMajor = gridcolor:darkgrey increment:1208 start:0 ScaleMinor = gridcolor:lightgrey increment:604 start:0 BackgroundColors = canvas:sfondo
BarData=
 bar:1920 text:1920
 bar:1930 text:1930
 bar:1940 text:1940
 bar:1950 text:1950
 bar:1960 text:1960
 bar:1970 text:1970
 bar:1980 text:1980
 bar:1990 text:1990
 bar:2000 text:2000
 bar:2010 text:2010
 bar:2020 text:2020
 bar:2024 text:present
PlotData=
 color:barra width:25 align:left
 bar:1920 from: 0 till:4832
 bar:1930 from: 0 till:4122
 bar:1940 from: 0 till:3498
 bar:1950 from: 0 till:3499
 bar:1960 from: 0 till:3100
 bar:1970 from: 0 till:2611
 bar:1980 from: 0 till:2391
 bar:1990 from: 0 till:2108
 bar:2000 from: 0 till:1924
 bar:2010 from: 0 till:1680
 bar:2020 from: 0 till:1736
 bar:2024 from: 0 till:1795 color:darkblue
PlotData=
 bar:1920 at:4832 fontsize:M text:4,832 shift:(-16,6)
 bar:1930 at:4122 fontsize:M text:4,122 shift:(-16,6)
 bar:1940 at:3498 fontsize:M text:3,498 shift:(-16,6)
 bar:1950 at:3499 fontsize:M text:3,499 shift:(-16,6)
 bar:1960 at:3100 fontsize:M text:3,100 shift:(-16,6)
 bar:1970 at:2611 fontsize:M text:2,611 shift:(-16,6)
 bar:1980 at:2391 fontsize:M text:2,391 shift:(-16,6)
 bar:1990 at:2108 fontsize:M text:2,108 shift:(-16,6)
 bar:2000 at:1924 fontsize:M text:1,924 shift:(-16,6)
 bar:2010 at:1680 fontsize:M text:1,680 shift:(-16,6)
 bar:2020 at:1736 fontsize:M text:1,736 shift:(-16,6)
 bar:2024 at:1795 fontsize:M text:1,795 shift:(-16,6)
TextData=
 fontsize:S pos:(20,20)
 text:Data from U.S. Census Bureau
</timeline>
Communities
Cities
- Beach (county seat)
- Golva
- Sentinel Butte
Unincorporated communities
Source:<ref name=GVCND/> Template:Div col
- Chama
- De Mores
- Ekre
- Rider
- Thelan
- Trotters
Townships
Former townships
Unorganized territories
- East Golden Valley
- Elmwood (formerly a township)
- North Golden Valley
- South Golden Valley
Politics
Golden Valley County voters have been reliably Republican for decades. In no national election since 1936 has the county selected the Democratic Party candidate (as of 2024). Template:PresHead Template:PresRow Template:PresRow Template:PresRow Template:PresRow Template:PresRow Template:PresRow Template:PresRow Template:PresRow Template:PresRow Template:PresRow Template:PresRow Template:PresRow Template:PresRow Template:PresRow Template:PresRow Template:PresRow Template:PresRow Template:PresRow Template:PresRow Template:PresRow Template:PresRow Template:PresRow Template:PresRow Template:PresRow Template:PresRow Template:PresRow Template:PresRow Template:PresRow Template:PresFoot
Education
School districts include:<ref name="SchoolDistrict">Template:Cite map - Text list</ref>
Notable people
- Ernest Viggo Almquist, commercial artist <ref>Frontier Cavalcade, The Dickinson Press, March 14, 1957</ref>
- Arthur C. Townley, founder of the North Dakota Nonpartisan League.<ref name=archives/>
See also
Gallery
-
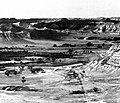
 Rangeland, wooded drainageways, and badland
 -
 Stream valley, rangeland and badland
 -
 Church building in Trotters


References
External links
- Golden Valley County map, North Dakota DOT
Template:Golden Valley County, North Dakota Template:US state navigation box Template:Authority control